Mapping the Lightning Network: Node Metrics and Fee Rates
Stroom Network’s latest research reveals key insights into the Lightning Network’s node metrics, focusing on capacity, connectivity, and fee structures for optimized routing.
•
6 min read

The Lightning Network (LN) is one of the most innovative solutions in the world of cryptocurrency, designed to address Bitcoin's scalability challenges. Acting as a secondary layer for Bitcoin transactions, LN enables faster, cheaper, and off-chain micro-transactions. However, the efficiency of this network depends heavily on the dynamics and configuration of its nodes.
By April 2024, the Lightning Network comprised approximately 14,000 nodes interconnected by over 53,000 channels. Understanding the metrics of these nodes, from capacity to connectivity, is crucial both for users seeking optimal paths and node operators aiming to enhance network functionality.
The first part of a research conducted by the Stroom Network team offers an in-depth analysis of various node metrics, examining aspects such as capacity, channel count, and fee rates. By dissecting these elements, we can identify what makes certain nodes critical to the network’s liquidity and efficiency. These metrics also provide valuable insights for machine learning applications, where predicting high-performing nodes could improve network routing and reduce transaction costs.
Data Cleaning
To ensure that the analysis focused on relevant and active nodes, a data-cleaning process was applied to refine the dataset. Nodes with fewer than two channels were excluded, narrowing the initial set of 14,142 nodes down to 5,122. This filtering step helped to concentrate on nodes with established activity, which are more likely to participate actively in the network’s transaction flow.
Additionally, to improve clarity and avoid skewed interpretations, certain visualizations were restricted to data points below certain percentiles. This approach allows the analysis to reflect the broader trends within the network, minimizing the distortion caused by extreme outliers.
Capacity Metrics
Lightning Network capacity metrics measure the total Bitcoin locked in the channels, indicating the amount available for instant transactions. These metrics are essential as they reflect the network’s scalability, liquidity, and ability to support a growing number of users and transactions efficiently.
Nodes’ Capacity
The capacity metric indicates the overall liquidity a node holds, showing the total amount of Bitcoin it can support for processing transactions. A key takeaway from our research is that most nodes are not equipped for high-capacity transfers. With 25% of nodes holding less than 2.64 million satoshis, and a median capacity of 10.55 million satoshis, it becomes apparent that liquidity is skewed.
This uneven distribution suggests that while there are many participating nodes, only a minority can handle significant transaction volumes. This imbalance may lead to bottlenecks when large payments attempt to route through lower-capacity nodes.
Median Channel Capacity
Examining the median channel capacity shows patterns in channel sizes that reflect typical transactions size. The median channel size of 1.07 million satoshis suggests that the majority of nodes operate with moderate liquidity. Despite the presence of a few outliers with notably high capacities, the majority of nodes align with what could be considered “standard” sizes on the network. This characteristic suggests a baseline level of liquidity across the network that aids in maintaining transaction flow.
Capacity Change over 90 Days
Tracking capacity changes over time reveals the network's stability and its more dynamic participants. A large number of nodes showed no capacity change over 90 days, pointing to a relatively stable liquidity profile for many nodes. However, nodes that actively increased or decreased capacity indicate active liquidity management, potentially aiming for optimization in routing or staying competitive. These dynamic nodes are often key players, providing flexible and responsive paths in the network's transaction flow.
Channel Count Metrics
Lightning Network channel count metrics measure the total number of active payment channels, representing pathways through which transactions can be routed. These metrics are important as they indicate the network's connectivity and robustness, affecting its ability to handle transactions smoothly and efficiently.
Number of Node's Channels
Another crucial metric is the number of channels a node maintains. Our research shows that around 75% of all LN nodes operate with fewer than four channels, marking a distinct contrast between low-activity and highly connected nodes. These high-connectivity nodes serve as network hubs, facilitating a larger share of the network’s traffic. By establishing numerous connections, these nodes enhance both redundancy and network reach, thereby becoming crucial for efficient routing. However, the low connectivity of the majority of nodes might lead to a dependency on these hub nodes, potentially centralizing certain routing functions.
Fee Rate Metrics
Fee structures are crucial to the Lightning Network's appeal, as low fees drive network activity by making micro-transactions viable.
Median In / Out Fees
The median in fee rate reveals that a significant proportion of nodes—approximately 25%—set minimal fees at 1 ppm* or lower. About half of the nodes charge in fees below 60 ppm, while only a quarter set rates above 288 ppm. This preference among the majority for low or no fees signals a focus on network accessibility over profit, which aligns with the Lightning Network's mission to enable small, frequent transactions without imposing significant financial burdens on users.
Out fees also tend to remain low, with 50% of nodes setting them at below 10 ppm. This trend supports competitive fee structures, promoting increased usage. Notable spikes around common fee rates (e.g., 250, 500, and 1,000 ppm) may reflect popular strategies among node operators for striking a balance between cost-effectiveness and visibility within the network.
* In the context of Lightning Network fees, ppm stands for "parts per million" and is used as a unit to express fee rates. Specifically, it denotes the fee charged per one million units of currency (in our case, the talk is about satoshis, which are the smallest units of Bitcoin) that a node sets for routing payments through its channels. For example, a fee rate of 100 ppm means that for every 1 million satoshis routed through the node, the node charges a fee of 100 satoshis.
Maximum In / Out Fees
The maximum fee distribution indicates that while most nodes keep fees low, a subset deliberately sets high transaction fees, possibly as a strategy to discourage low-profit routes or to control traffic. Roughly 25% of nodes maintain max in fees below 350 ppm, whereas out fees remain significantly lower for most nodes. Spikes at 5,000 ppm and 10,000 ppm suggest intentional fee barriers, signaling that some nodes aim to redirect or prioritize specific traffic flows.
Weighted Mean Fee Ratio
This ratio provides insight into the balance between in and out fees. Approximately 50% of nodes maintain a weighted mean ratio below 0.2006, indicating that the in fees they charge are lower compared to the out fees. This approach is likely to attract more incoming transactions, enhancing user traffic and potentially elevating a node’s significance within the network.
Conclusion
The Lightning Network’s dynamics are deeply rooted in the diverse configurations of its nodes. By examining node capacity, connectivity, and fee structures, this analysis reveals a network that relies on both highly connected hubs and strategically fee-balanced nodes.
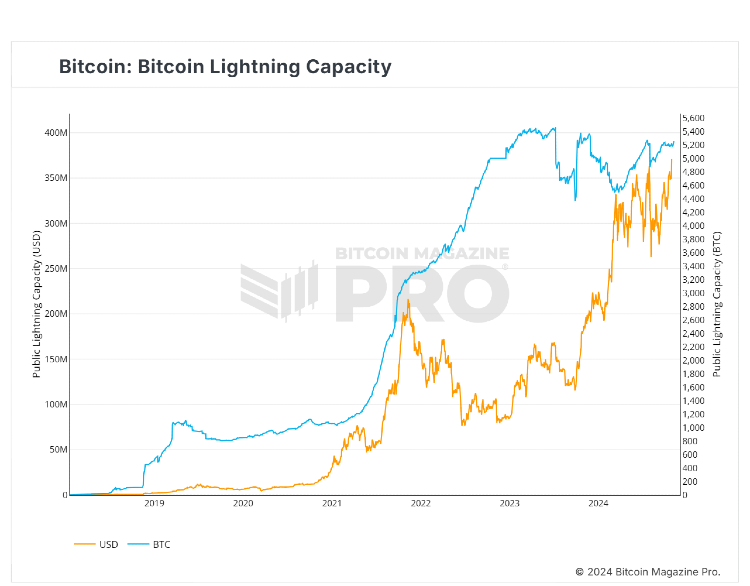
These insights also underscore the potential for machine learning models to predict optimal routing paths by identifying promising nodes based on their performance metrics, while also highlighting the power of data-driven decision-making in networked systems. As LN continues to grow, with its overall capacity in US dollar terms hovering around an all-time high of over $370 million as of the end of October 2024, understanding the roles and behaviors of nodes will be central to enhancing its efficiency and accessibility for users worldwide.

In the next part of this analysis, we’ll delve deeper into graph centrality, explore the reachability within multi-hop metrics, and examine the dynamics of closed channels—offering a closer look at the nuances shaping node stability and transaction flow within the network.
Going further, the next step in this study will be to develop a machine learning model to recommend the best peers for routing, further improving transaction speed, cost, and reliability across the network. Stay tuned!
*****
We trust you've found this article helpful. To learn more about Stroom, access detailed information about our technology, or explore how you can join the ecosystem, visit the following resources:
Official website: https://stroom.network/
Whitepaper: https://stroom.network/Primer.pdf
Twitter (X): https://x.com/StroomNetwork
Discord: https://discord.gg/DZ53WjDXz9
Telegram: https://t.me/stroomnetwork

Stroom DAO
View our other posts

Bitcoin Without Borders: Unlocking Bitcoin's Multi-Chain Potential
Since the birthday of the first Bitcoin block on January 3, 2009, a new era of financial assets has begun - the cryptocurrency era. Unmatched security, permissionlessness, and decentralization cemented Bitcoin'
Stroom DAO

Lightning Network in 2025: Bitcoin’s Transformation into Everyday Money
Bitcoin’s Lightning Network is transforming from an experiment into a global payment system, making everyday transactions faster and cheaper.
Stroom DAO

Lightning Network: Celebrating 9 Years of Innovation
The Lightning Network whitepaper was unveiled on January 14, 2016, introducing a transformative layer atop Bitcoin for instant, scalable transactions.
Stroom DAO